
“What gets measured gets managed.” In digital marketing, this principle separates thriving campaigns from wasted budgets. Data-driven marketing decisions eliminate guesswork and focus resources where they generate the best returns.
This guide will help you build an analytics framework that turns data into actionable insights and measurable results.
Why Data-Driven Marketing Matters
Gut instinct has its place, but data reveals what actually works:
Benefits of data-driven marketing:
- 5-8x higher ROI compared to companies that don’t use data
- Faster identification of winning strategies
- Reduced waste on underperforming channels
- Clearer understanding of customer behavior
- Evidence-based budget allocation
The challenge isn’t accessing data—it’s knowing which data matters and how to act on it.
Defining Your Marketing KPIs
Key Performance Indicators (KPIs) are the metrics that directly measure progress toward your business goals. Not every metric is a KPI.
Choosing the Right KPIs
The KPI hierarchy:
| Business Goal | Marketing KPI | Supporting Metrics |
|---|---|---|
| Revenue growth | Marketing-attributed revenue | Leads, conversions |
| Brand awareness | Share of voice | Impressions, reach |
| Customer acquisition | Cost per acquisition (CPA) | Traffic, conversion rate |
| Customer retention | Customer lifetime value | Repeat purchase rate |
Pro Tip: Limit yourself to 3-5 primary KPIs. Too many KPIs dilutes focus and makes optimization impossible.
KPIs by Marketing Channel
SEO KPIs:
- Organic traffic growth
- Keyword rankings
- Organic conversion rate
Paid advertising KPIs:
- Return on ad spend (ROAS)
- Cost per acquisition
- Click-through rate
Email marketing KPIs:
- Revenue per subscriber
- List growth rate
- Engagement rate
Social media KPIs:
- Engagement rate
- Referral traffic
- Attributed conversions
Vanity Metrics vs. Actionable Metrics
Vanity metrics look impressive but don’t drive decisions:
- Total followers
- Page views without context
- Likes and impressions alone
Actionable metrics inform strategy:
- Conversion rate by source
- Revenue per visitor
- Cost per lead by channel
- Customer acquisition cost
Focus your dashboards on actionable metrics that guide optimization.
Mastering Google Analytics 4
GA4 is now the standard for web analytics. Understanding its capabilities is essential for data-driven marketing.
GA4 Fundamentals
GA4 differs significantly from Universal Analytics:
Event-based tracking: Everything is an event—page views, clicks, scrolls, purchases. This provides more flexibility but requires intentional setup.
Cross-platform measurement: Track users across web and app in a single property.
Privacy-first design: Built with cookieless tracking and privacy regulations in mind.
Essential GA4 Reports
Acquisition reports:
- Where traffic comes from
- How different channels perform
- User acquisition vs. traffic acquisition
Engagement reports:
- Which pages users visit
- How long they stay
- What actions they take
Monetization reports:
- Revenue by source
- Product performance
- Purchase journeys
Setting Up Conversions
Without conversion tracking, you’re flying blind. Configure these in GA4:
Standard events to track:
- Form submissions
- Button clicks
- File downloads
- Video plays
- Scroll depth
- Purchases
Create custom events for business-specific actions that matter to your goals.
Attribution Models Explained
Attribution determines which marketing touchpoints get credit for conversions. The model you choose significantly impacts how you evaluate channel performance.
Common Attribution Models
Last-click attribution:
- 100% credit to final touchpoint
- Easy to understand
- Undervalues awareness activities
- GA4 default for many reports
First-click attribution:
- 100% credit to first touchpoint
- Values discovery channels
- Ignores nurturing activities
- Useful for awareness campaigns
Linear attribution:
- Equal credit to all touchpoints
- Simple but oversimplified
- Treats all interactions equally
- Doesn’t reflect reality
Time decay attribution:
- More credit to recent touchpoints
- Reflects recency importance
- Better for long sales cycles
- May undervalue early touchpoints
Data-driven attribution:
- Uses machine learning
- Assigns credit based on actual impact
- Requires sufficient conversion data
- GA4’s recommended model
Choosing Your Attribution Model
| Business Type | Recommended Model | Reason |
|---|---|---|
| E-commerce (short cycle) | Data-driven or Last-click | Quick decisions |
| B2B (long cycle) | Data-driven or Time decay | Multiple touchpoints |
| High consideration | Data-driven or Position-based | Journey matters |
| Brand awareness | First-click | Discovery focus |
For most businesses, data-driven attribution provides the most accurate picture when sufficient data exists.
Building a Marketing Dashboard
Effective dashboards surface insights without overwhelming with data.
Dashboard Design Principles
- Focus on KPIs, not every metric
- Show trends, not just snapshots
- Include context (goals, benchmarks)
- Update automatically when possible
- Make it accessible to stakeholders
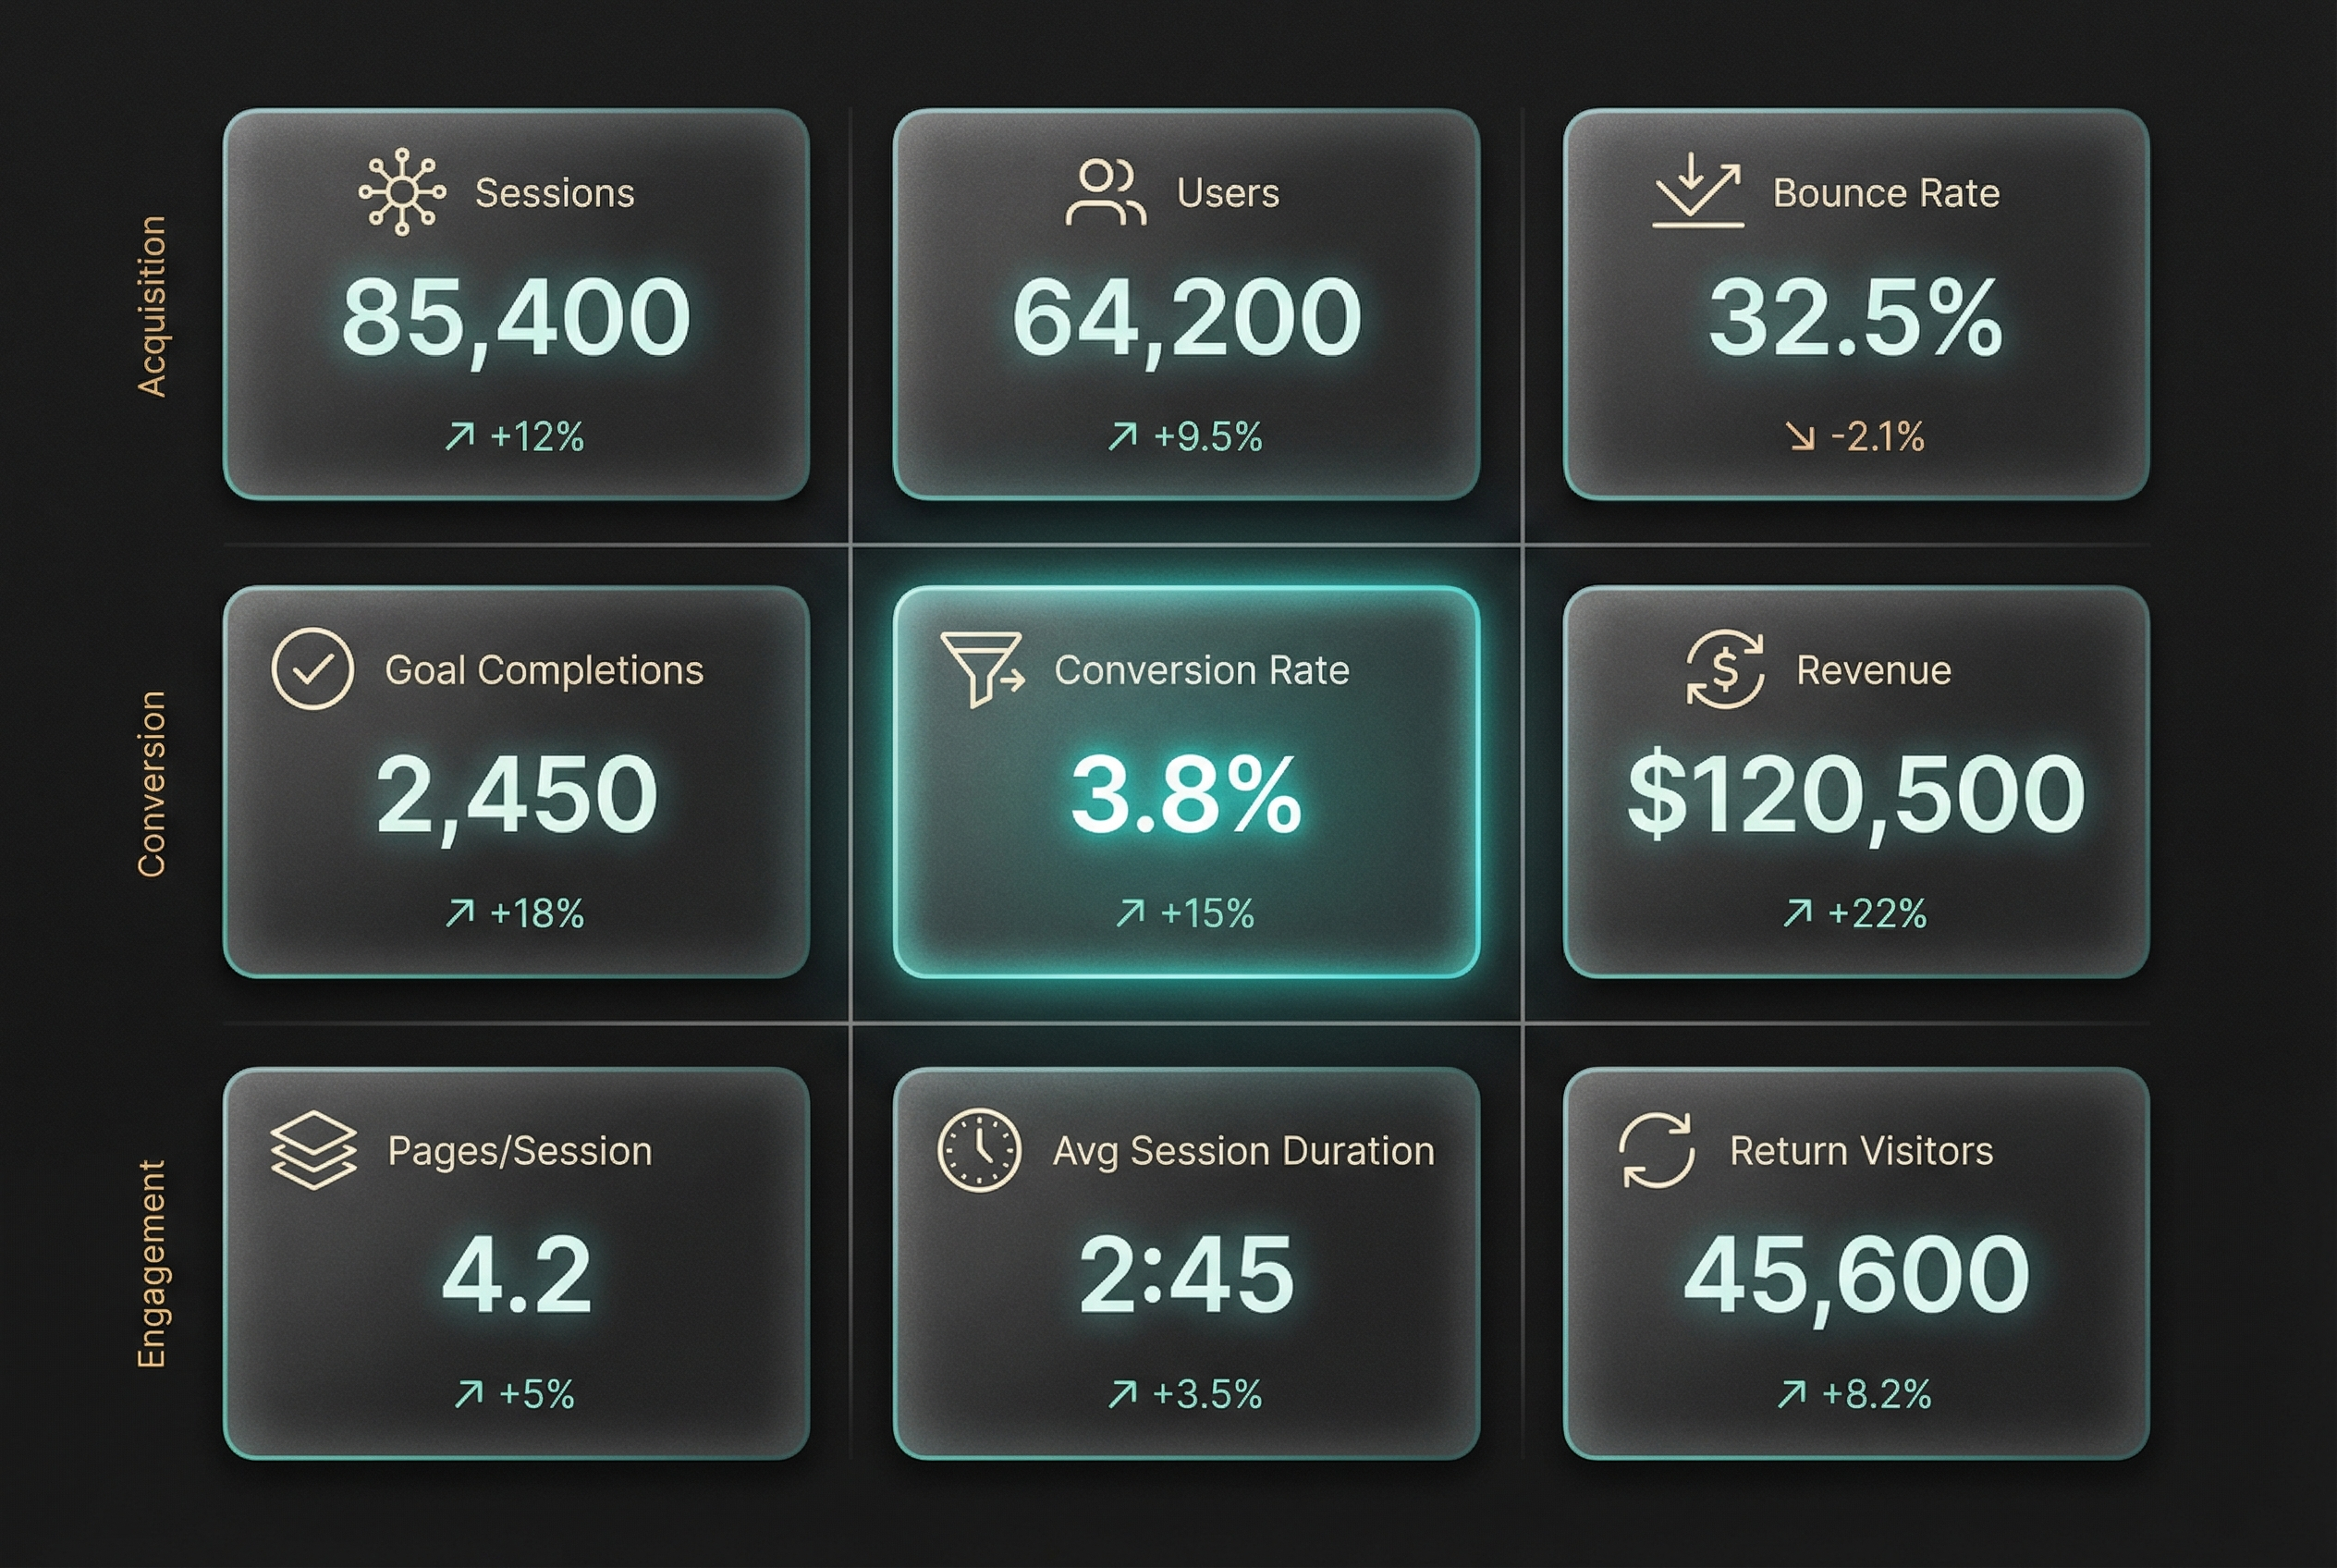
Essential Dashboard Components
Overview section:
- Primary KPIs with trend indicators
- Goal progress
- Period-over-period comparison
Channel performance:
- Traffic by source
- Conversions by channel
- ROI/ROAS by campaign
Audience insights:
- New vs. returning users
- Geographic distribution
- Device breakdown
Conversion funnel:
- Drop-off at each stage
- Conversion rate optimization opportunities
- Time to conversion
Recommended Tools
Free options:
- Google Looker Studio (formerly Data Studio)
- GA4 built-in reports
- Google Sheets
Paid options:
- Tableau
- Power BI
- Databox
- AgencyAnalytics
From Data to Decisions
Data without action is just numbers. Build a process for turning insights into improvements.
The Analysis-to-Action Framework
1. Observe: What does the data show? “Conversion rate dropped 15% last month.”
2. Diagnose: Why is this happening? “Mobile conversion rate dropped while desktop stayed stable.”
3. Hypothesize: What might fix it? “Mobile checkout experience may have issues.”
4. Test: Implement and measure. “A/B test simplified mobile checkout.”
5. Learn: What worked? “Simplified form increased mobile conversions 22%.”
Avoiding Common Analysis Mistakes
Reacting to noise: Single data points fluctuate. Look for sustained trends before making changes.
Ignoring context: A traffic drop during holidays isn’t a crisis. Understand seasonality and external factors.
Correlation vs. causation: Just because two metrics move together doesn’t mean one causes the other.
Analysis paralysis: Don’t wait for perfect data. Make decisions with good-enough data and iterate.
Frequently Asked Questions
How much data do I need before making decisions?
For basic trend analysis, 30 days of data provides reasonable insights. For statistical significance in A/B tests, use sample size calculators—typically hundreds or thousands of conversions depending on the effect size you want to detect.
Should I track everything possible?
No. Track what matters for your goals. Excessive tracking creates data noise, slows sites, and raises privacy concerns. Start minimal, then add tracking as specific questions arise.
How often should I review marketing analytics?
Daily checks for anomalies, weekly reviews for tactical adjustments, monthly analysis for strategic decisions. Quarterly deep dives help identify larger patterns and opportunities.
Conclusion
Data-driven marketing isn’t about tracking everything—it’s about tracking the right things and acting on what you learn. Define clear KPIs aligned with business goals, build measurement systems that capture meaningful data, and create processes that turn insights into action.
Start with the fundamentals: ensure your GA4 is properly configured, define your primary KPIs, and build a simple dashboard you’ll actually use.
Your action step: This week, audit your current analytics setup. Verify that your most important conversions are being tracked accurately, then identify one data-driven optimization you can implement based on what you find.